The "Bot" panel on the right
The "Bot" panel lives in the platform's right column, next to the platform's own tabs. This article explains what each of its tabs shows: "Neighbor TF", "Patterns", "AI" and "Statistics". Candlestick patterns and the language model are described in detail in their own articles.
Where to open it
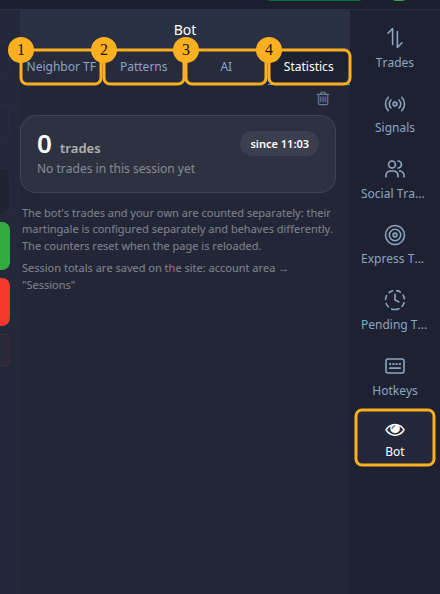
In the platform's right column press the "Bot" icon. The panel opens in place of the platform's trade list. The tabs are at the top.
Some tabs have a gear above the content on the right — the settings of this tab.
If a tab says it works after signing in or is not included in your plan, sign in to your 7tra.de account or see the article about plans.
"Neighbor TF"
Large candles of the neighbouring timeframe to the open chart: for example, two-minute ones if the chart is one-minute. The last candle moves with every price change, and you can see how long is left until it closes. This helps to catch the moment of a manual entry.
What is on the card:
- candles of the neighbouring timeframe and the countdown to the close of the current one;
- the "▼ | ▲" switch in the header — take a timeframe lower or higher than the open chart;
- the vote bar — how many indicators look up and how many look down on the last closed candle. Press it to see who voted how. This is a count of votes, not a probability of movement;
- the forming pattern — a candlestick pattern taking shape on the current, not yet closed candle, and how far it has formed. Press it to open its description.
The tab's gear opens the "Neighbor TF: display" window:
| Field | What it sets |
|---|---|
| Candles on the chart | How many candles to show. The fewer, the larger they are. |
| Data source | Which chart to take quotes from. By default — the neighbouring timeframe to the open chart. |
| Neighbor timeframe | "Higher than the open chart" or "Lower than the open chart". |
| Pattern threshold, % | How far a pattern must have formed to be shown. |
The widget's data source is not the same as the bot's chart. The chart the bot takes signals from is set in "Settings" → "General" → "The bot works with chart".
"Patterns"
Candlestick patterns formed on the last closed candle, on all of the bot's assets. Press a line — the bot opens the asset and outlines the pattern on the chart. The gear — which patterns to track.
In detail — in the article about candlestick patterns.
"AI"
What the language model answered for the open asset: up, down or skip, with an explanation and risks. Below — the feed of questions for the last hour. The "Ask now" button asks a one-off question and does not open a trade. The gear opens the "AI" window.
In detail — in the article about the "AI" window.
"Statistics"
The result of the current session — since the platform tab was opened.
At the top is the "Today's limits" card, if you have set limits on the "Limits" tab in the settings. It shows the day's total of the bot's trades and a bar for each limit: how much has built up and how much is allowed. Under the total it says since when it is counted: "since midnight", or "since 10:42" if the counters were reset or the limits were turned on during the day. In the top right — "running" or "stopped" with the reason. Press the card to open the limit settings. If limits are off, a line with a "Set up" link takes the card's place.
Limits keep their own count: the day by the computer clock and only the bot's trades. The bin and a page reload do not reset them. To reset them, use the arrow button at the top of the tab, left of the bin — the bot asks for confirmation. After the reset the bot can again trade up to the full limits. If it was stopped by a limit, the stop is lifted, but only "Start" turns trading on.
The bot and your trades each have a card:
- result in money — in large type;
- winrate — the share of wins. Draws are not counted in it;
- how many trades and since when;
- a bar of wins and losses;
- the latest trades as coloured squares, newest on the right;
- the "Martingale" line — how many chains recovered and how many broke.
Under each card there is a breakdown by asset. Press an asset — it opens on the chart.
The bot's trades and yours are counted separately: martingale is set up separately for them and behaves differently. If you do not want to see your trades, untick "Count your trades in statistics" in the settings, on the "User settings" tab.
The bin at the top of the tab resets the session counters. The arrow button to its left resets the limit counters — see above. Resetting does not affect trading itself.
When the page is reloaded, the counters start over. Session totals are saved on the site — the "account area → "Sessions"" link at the bottom of the tab. You can export them as a table there.
What the panel does not do
- It does not open trades. No tab trades. Even a question to the model here is only a question.
- It does not change the strategy. The widgets show the market, and the strategy calculates by its own rules.
- It does not keep statistics in the browser. After a page reload they start over; past sessions are in the dashboard on the site.
Frequently asked questions
"Neighbor TF" says there is no chart or it is closed. The platform sends quotes only for open charts. Open a chart and choose an asset on it.
"Neighbor TF" says the quotes have stopped. If the market is open, wait: the stream usually recovers by itself. If not — reload the page.
The statistics were reset. The page was reloaded or the bin was pressed. See the totals of past sessions in the dashboard, the "Sessions" section.
The total in "Today's limits" does not match the bot's total below. They are counted from different times. The session — since the platform tab was opened. The limits — since midnight or since the last reset with the arrow button. Under each sum it says since when it is counted.
What's next
- Candlestick patterns — the "Patterns" tab and "My patterns".
- The "AI" window — how to connect a language model.
- Trading: start, stop and bot status — how to start trading.